During the last months at work, we’ve embraced a new technology called Graphite. In simple terms Graphite is a daemon able to collect data and present them in various graphs. Want to show a chart showing number of daily requests? Graphite is your friend. Want to show the development in user sign ups? Graphite is your friend. Want to … you probably get it by now. The collection engine in Graphite called Carbon, is extremely good at collecting data as well as serves the data to other types of applications through a HTTP API. In this post I will show you how to integrate graphite into your .NET web projects.
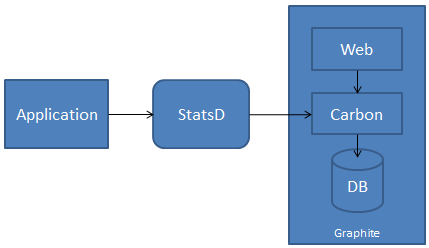
Let’s spend a little time looking at how metrics are added to Graphite. Graphite provides different ways of feeding it. The easiest solution is to choose one of the tools able to push data into Graphite. A guy at work already picked StatsD and it turned out as a great component for aggregating data. StatsD is pretty much a simple API based on UDP, collecting data and shipping them off to Graphite. StatsD provides standard metric types like counters and timers and luckily this component handles all of the communication with Graphite. Boiled down StatsD collect, aggregate and send metrics to Graphite, which stores and serves it.
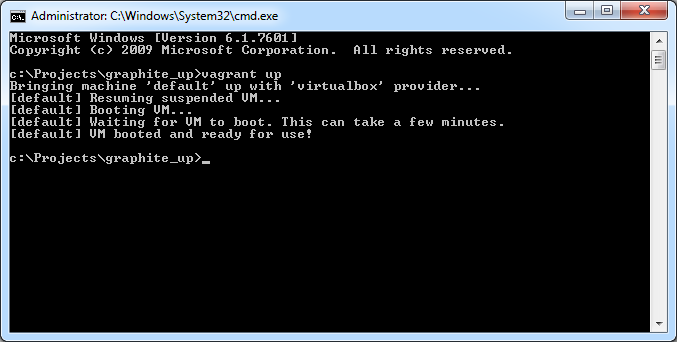
With that background info in place, we can start playing with Graphite. The software is developed for Linux, which makes it chill down every .NET developers back. Luckily, Suan-Aik Yeo made it darn simple installing both Graphite and StatsD on a Windows machine. I won’t go into detail about the installation, because it is pretty well documented in the graphite_up project. In short, you will use Vagrant to spin up a virtual machine with Graphite and StatsD installed and configured. I had a lot of problems selecting the right versions of Vagrant and VirtualBox, to get graphite_up working. The following versions work with the current revision of graphite_up:
- Vagrant version 1.2.2
- VirtualBox version 4.2.14
When setup run your virtual machine:
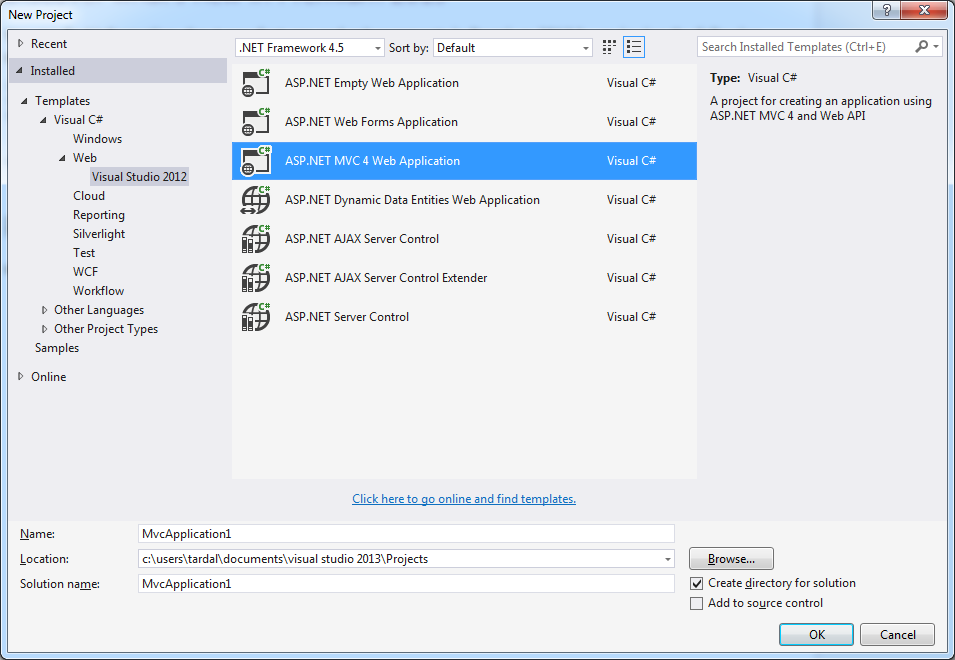
You’re ready to rock and roll. Start Visual Studio and create a new ASP.NET MVC project:
In order for your project to be able to talk to StatsD, you need a package able to send UDP packages. You can use the UdpClient in .NET, but the easiest way of talking to StatsD, is to include C# Statsd Client by Goncalo Pereira:
Let’s start by doing something simple with our new project and StatsD. I want to log how long each request takes and show that as a graph in Graphite. For the purpose I’ve added a new controller named HomeController with a single method Index:
I’ve added a random sleep period to the action, in order to have something to show on the graph. Next up we need to log data to StatsD. I could add the StatsD code directly to the action, but I don’t really like having logging code, performance measuring code, exception handling code and so on in the controller directly. Let’s specify a new global filter instead:
In order for StatsdClient to know where to send the data, you need to configure that in your global.asax.cs:
And finally configure the new action filter as a global filter in global.asax.cs:
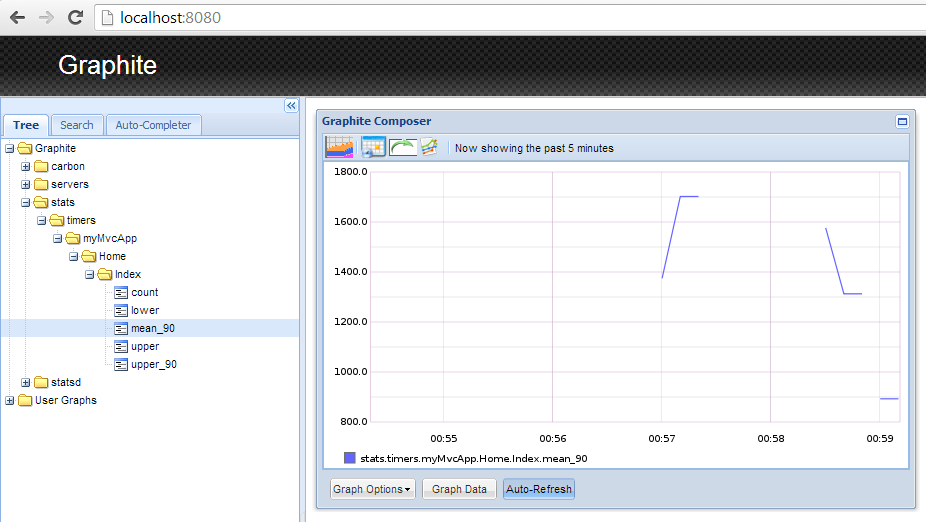
Start the website and hit the frontpage a couple of times to start generating some data. Then navigate to http://localhost:8080, which should open the Graphite UI. Your metrics are stored beneath the Graphite/stats/timers/myMvcApp. In the following sample, I’ve selected mean_90 on the Index action from Home and configured the graph to show data from the last 5 minutes: